This report provides information obtained through data from excel or tableu, respecting storm name for the time 6/26/2010 to 11/7/2010. This report will comment on the highligths of the data and search for possible correlations. These observations do have limitations which will be noted.
Although processing data is not the easiest thing for humans, analyzing data is simple. On the other hand, computers make data processing effortless but how far are they from being able to report them faithfully? This report sums up the information of 5 columns and 420 rows. The program identified 2 categorical features:
Considering the column Avg(Latitude), it is known: The average is between 13.28 and 32.11. The littlest value is in supergroup Gaston and the greatest value is in supergroup Shary. The greatest value is between 14.00 and 49.30. The littlest value is in supergroup Gaston and the greatest value is in supergroup Igor. The littlest value is between 11.00 and 27.30. The smallest value is in supergroup Danielle and the greatest value is in supergroup Shary. Considering Avg(Longitude), it is possible to take the following conclusions: The average is between -97.73 and -29.43. The minimum is in supergroup Hermine and the maximum value is in supergroup Lisa. The maximum is between -95.00 and -21.40. The smallest value is in supergroup Hermine and the maximum is in supergroup Julia. The littlest value is between -102.40 and -31.90. The littlest value is in supergroup Alex and the maximum value is in supergroup Lisa. When it comes to the column Avg(Wind Speed (Kt)), it is possible to conclude: The average is between 27.50 and 83.15. The littlest value is in supergroup Five and the biggest value is in supergroup Igor. The maximum is between 30.00 and 135.00. The littlest value is in supergroup Five and the biggest value is in supergroup Igor. The littlest value is between 20.00 and 35.00. The minimum is in supergroup Hermine and the greatest is in supergroup Shary.
After analyzing all possible values for Storm Name, coming about for every numeric class the major changes are in Earl's Avg(Latitude) with 41.23%, and in Julia's Avg(Longitude) with 26.91%, and in Karl's Avg(Wind Speed (Kt)) with 46.6%. By contrast, the minor changes are in Karl's Avg(Latitude) with 2.84%, and in Nicole's Avg(Longitude) and Avg(Wind Speed (Kt)) with 1.23%; 8.15%, respectively.
This conclusion follows from the fact that the minor change is in Nicole with a standard deviation mean of 1.66. By contrast, the biggest change is in Igor with a standard deviation average of 18.38.
And for each numeric category, the biggest change is in Avg(Wind Speed (Kt)), with a std of 27.16. On the other hand, the minor change is in Avg(Latitude), with a std of 7.23.
We can conclude too that the global maximum is 135.00 in Igor's Avg(Wind Speed (Kt)) and the global minimum is -102.40 in Alex's Avg(Longitude).
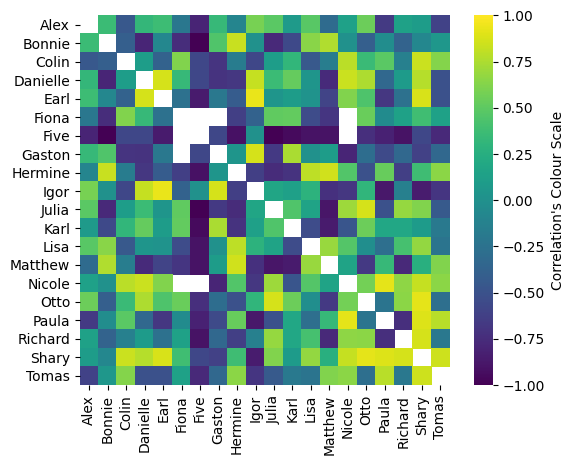
In this section, it is analyzed the correlation in the data. Correlation is a term that is a measure of the strength of a linear relationship between two quantitative variables. More specifically, it is composed by 2 key factors: strength and direction. While strength quantifies the correlation coefficient's value in absoltute range from 0 to 1, the sign of the coefficient indicates the direction of the relationship. In other words, the sign represents whereas the variables evolve in the same way and the absolute value the connection's power. For the 15 relevant correlations found regarding Avg(Wind Speed (Kt)), the most commun value is Five with 8 connections.
When it decreases, judging by the sinal, Alex; Karl; Lisa; Bonnie; Hermine; Julia; Richard; Matthew; increase with ratio (-0.8; -0.95; -0.9; -1.0; -0.91; -1.0; -0.9; -0.9). When Shary increases, judging by the sinal, Colin; Tomas; Otto; increase with ratio (0.84; 0.85; 0.92). As Earl tends to decrease, judging by the sinal, Igor; Danielle; tend to decrease togheter with a Pearson correlation coefficient of (0.93; 0.87).
It was found correlation's pairs that increase simultaneously which are Igor & Gaston w/ 0.87; Paula & Nicole w/ 0.92.
Note that it is never appropriate to conclude that changes in one variable cause changes in another based on correlation alone. Furthermore, the parallelism increase/decrease is mutual.
Date Storm Name Avg(Latitude) Avg(Longitude) Avg(Wind Speed (Kt)) 6/26/2010 3:00:00 AM ALEX 16.7 -84.4 30 6/26/2010 9:00:00 AM ALEX 16.9 -84.9 35 6/26/2010 3:00:00 PM ALEX 17.3 -86.1 40 6/26/2010 9:00:00 PM ALEX 17.3 -87.8 55 6/27/2010 3:00:00 AM ALEX 17.7 -88.4 50 6/27/2010 9:00:00 AM ALEX 18.3 -89.4 35 6/27/2010 3:00:00 PM ALEX 18.7 -90.6 30 6/27/2010 9:00:00 PM ALEX 19.2 -90.9 30 6/28/2010 3:00:00 AM ALEX 19.4 -91.3 40 6/28/2010 9:00:00 AM ALEX 19.7 -91.6 45 6/28/2010 3:00:00 PM ALEX 20.3 -91.7 50 6/28/2010 9:00:00 PM ALEX 20.5 -91.8 50 6/29/2010 3:00:00 AM ALEX 21.0 -91.6 55 6/29/2010 9:00:00 AM ALEX 21.7 -91.9 60 6/29/2010 3:00:00 PM ALEX 22.7 -93.1 60 6/29/2010 9:00:00 PM ALEX 23.2 -94.0 60 6/30/2010 3:00:00 AM ALEX 23.1 -94.8 65 6/30/2010 9:00:00 AM ALEX 23.3 -95.1 70 6/30/2010 3:00:00 PM ALEX 23.8 -95.5 70 6/30/2010 9:00:00 PM ALEX 24.5 -96.8 80 7/1/2010 3:00:00 AM ALEX 24.3 -97.8 85 7/1/2010 9:00:00 AM ALEX 24.0 -99.0 70 7/1/2010 3:00:00 PM ALEX 23.1 -100.3 45 7/1/2010 9:00:00 PM ALEX 23.2 -101.2 35 7/2/2010 3:00:00 AM ALEX 23.3 -102.4 25
Date Storm Name Avg(Latitude) Avg(Longitude) Avg(Wind Speed (Kt)) 7/22/2010 3:00:00 PM BONNIE 21.9 -75.0 30 7/22/2010 9:00:00 PM BONNIE 22.7 -75.4 30 7/23/2010 3:00:00 AM BONNIE 23.4 -76.5 35 7/23/2010 9:00:00 AM BONNIE 24.1 -78.6 35 7/23/2010 3:00:00 PM BONNIE 25.4 -80.3 35 7/23/2010 9:00:00 PM BONNIE 26.2 -81.9 30 7/24/2010 3:00:00 AM BONNIE 26.4 -83.4 30 7/24/2010 9:00:00 AM BONNIE 27.0 -85.1 30 7/24/2010 3:00:00 PM BONNIE 28.0 -86.7 25 7/24/2010 9:00:00 PM BONNIE 28.5 -87.6 25
Date Storm Name Avg(Latitude) Avg(Longitude) Avg(Wind Speed (Kt)) 8/2/2010 3:00:00 PM COLIN 12.6 -41.1 30 8/2/2010 9:00:00 PM COLIN 13.0 -42.5 30 8/3/2010 3:00:00 AM COLIN 13.6 -45.1 30 8/3/2010 9:00:00 AM COLIN 14.0 -47.2 35 8/3/2010 3:00:00 PM COLIN 14.2 -49.5 35 8/5/2010 9:00:00 PM COLIN 24.9 -66.3 40 8/6/2010 3:00:00 AM COLIN 26.3 -66.6 50 8/6/2010 9:00:00 AM COLIN 26.8 -67.4 40 8/6/2010 3:00:00 PM COLIN 27.1 -66.9 40 8/6/2010 9:00:00 PM COLIN 28.3 -66.8 40 8/7/2010 3:00:00 AM COLIN 29.1 -66.5 40 8/7/2010 9:00:00 AM COLIN 29.1 -66.5 40 8/7/2010 3:00:00 PM COLIN 29.0 -66.4 35 8/7/2010 9:00:00 PM COLIN 29.4 -65.7 35 8/8/2010 3:00:00 AM COLIN 29.7 -65.6 35 8/8/2010 9:00:00 AM COLIN 30.7 -65.6 35 8/8/2010 3:00:00 PM COLIN 32.0 -65.6 30 8/8/2010 9:00:00 PM COLIN 32.9 -65.6 25
Date Storm Name Avg(Latitude) Avg(Longitude) Avg(Wind Speed (Kt)) 8/21/2010 9:00:00 PM DANIELLE 11.0 -32.1 25 8/22/2010 3:00:00 AM DANIELLE 11.3 -32.6 30 8/22/2010 9:00:00 AM DANIELLE 12.1 -33.4 30 8/22/2010 3:00:00 PM DANIELLE 12.7 -34.1 30 8/22/2010 9:00:00 PM DANIELLE 13.4 -35.1 35 8/23/2010 3:00:00 AM DANIELLE 14.2 -35.9 45 8/23/2010 9:00:00 AM DANIELLE 14.8 -37.1 50 8/23/2010 3:00:00 PM DANIELLE 15.1 -39.4 55 8/23/2010 9:00:00 PM DANIELLE 15.4 -41.5 65 8/24/2010 3:00:00 AM DANIELLE 15.6 -43.2 75 8/24/2010 9:00:00 AM DANIELLE 15.9 -44.6 85 8/24/2010 3:00:00 PM DANIELLE 16.6 -46.5 70 8/24/2010 9:00:00 PM DANIELLE 17.5 -48.2 60 8/25/2010 3:00:00 AM DANIELLE 18.2 -49.8 65 8/25/2010 9:00:00 AM DANIELLE 18.8 -51.0 75 8/25/2010 3:00:00 PM DANIELLE 19.6 -52.3 75 8/25/2010 9:00:00 PM DANIELLE 21.2 -53.1 75 8/26/2010 3:00:00 AM DANIELLE 22.4 -54.1 85 8/26/2010 9:00:00 AM DANIELLE 23.4 -54.9 90 8/26/2010 3:00:00 PM DANIELLE 24.4 -55.9 90 8/26/2010 9:00:00 PM DANIELLE 25.2 -57.0 95 8/27/2010 3:00:00 AM DANIELLE 25.8 -57.6 95 8/27/2010 9:00:00 AM DANIELLE 26.5 -58.7 115 8/27/2010 3:00:00 PM DANIELLE 26.9 -59.8 115 8/27/2010 9:00:00 PM DANIELLE 27.3 -60.3 115 8/28/2010 3:00:00 AM DANIELLE 28.1 -60.6 115 8/28/2010 9:00:00 AM DANIELLE 28.6 -61.0 95 8/28/2010 3:00:00 PM DANIELLE 29.3 -60.5 95 8/28/2010 9:00:00 PM DANIELLE 30.3 -59.7 90 8/29/2010 3:00:00 AM DANIELLE 31.5 -58.8 90 8/29/2010 9:00:00 AM DANIELLE 33.2 -57.3 80 8/29/2010 3:00:00 PM DANIELLE 35.5 -55.5 75 8/29/2010 9:00:00 PM DANIELLE 38.0 -54.5 70 8/30/2010 3:00:00 AM DANIELLE 39.3 -53.0 70 8/30/2010 9:00:00 AM DANIELLE 40.4 -52.0 65 8/30/2010 3:00:00 PM DANIELLE 40.9 -50.7 65 8/30/2010 9:00:00 PM DANIELLE 41.3 -49.0 60 8/31/2010 3:00:00 AM DANIELLE 41.4 -47.2 60
Date Storm Name Avg(Latitude) Avg(Longitude) Avg(Wind Speed (Kt)) 8/25/2010 5:00:00 PM EARL 14.3333 -31.2667 32 8/25/2010 11:00:00 PM EARL 14.5000 -32.6667 35 8/26/2010 5:00:00 AM EARL 14.8667 -34.0000 37 8/26/2010 11:00:00 AM EARL 15.1000 -35.5667 40 8/26/2010 5:00:00 PM EARL 15.0000 -37.6667 40 8/26/2010 11:00:00 PM EARL 15.3000 -39.2667 40 8/27/2010 5:00:00 AM EARL 15.6333 -40.6667 40 8/27/2010 11:00:00 AM EARL 15.8333 -42.2667 40 8/27/2010 5:00:00 PM EARL 15.7333 -44.4000 40 8/27/2010 11:00:00 PM EARL 15.8667 -46.6000 40 8/28/2010 5:00:00 AM EARL 16.0667 -48.3667 45 8/28/2010 11:00:00 AM EARL 15.7667 -50.8333 50 8/28/2010 5:00:00 PM EARL 16.0667 -52.7333 47 8/28/2010 11:00:00 PM EARL 16.5000 -54.4667 53 8/29/2010 5:00:00 AM EARL 16.6667 -55.9333 55 8/29/2010 11:00:00 AM EARL 17.0333 -57.3667 58 8/29/2010 5:00:00 PM EARL 17.3333 -58.7333 65 8/29/2010 11:00:00 PM EARL 17.6667 -60.0333 75 8/30/2010 5:00:00 AM EARL 18.0333 -61.5667 85 8/30/2010 11:00:00 AM EARL 18.3667 -62.7333 93 8/30/2010 5:00:00 PM EARL 19.0000 -64.0000 110 8/30/2010 11:00:00 PM EARL 19.4000 -65.1000 115 8/31/2010 5:00:00 AM EARL 19.9000 -66.2000 115 8/31/2010 11:00:00 AM EARL 20.7000 -67.2000 115 8/31/2010 5:00:00 PM EARL 21.4000 -68.3000 115 8/31/2010 11:00:00 PM EARL 22.3333 -69.0000 115 9/1/2010 5:00:00 AM EARL 23.3333 -70.4333 115 9/1/2010 11:00:00 AM EARL 24.3333 -71.4667 110 9/1/2010 5:00:00 PM EARL 25.5000 -72.5000 110 9/1/2010 11:00:00 PM EARL 26.9000 -73.4333 115 9/2/2010 5:00:00 AM EARL 28.3333 -74.2000 120 9/2/2010 11:00:00 AM EARL 29.8333 -74.7667 125 9/2/2010 5:00:00 PM EARL 31.4333 -75.0667 113 9/2/2010 11:00:00 PM EARL 32.8333 -74.8667 97 9/3/2010 5:00:00 AM EARL 34.3333 -74.3333 90 9/3/2010 11:00:00 AM EARL 35.9000 -73.7333 90 9/3/2010 5:00:00 PM EARL 37.2667 -72.7000 72 9/3/2010 11:00:00 PM EARL 38.8000 -71.1333 67 9/4/2010 5:00:00 AM EARL 40.4000 -68.7667 60 9/4/2010 11:00:00 AM EARL 42.5000 -66.2333 60 9/4/2010 5:00:00 PM EARL 45.3000 -63.6333 60 9/4/2010 11:00:00 PM EARL 48.7667 -61.0000 57
Date Storm Name Avg(Latitude) Avg(Longitude) Avg(Wind Speed (Kt)) 8/30/2010 9:00:00 PM FIONA 14.4 -48.7 35 8/31/2010 3:00:00 AM FIONA 15.1 -50.8 35 8/31/2010 9:00:00 AM FIONA 15.8 -53.0 35 8/31/2010 3:00:00 PM FIONA 15.9 -55.3 35 8/31/2010 9:00:00 PM FIONA 16.7 -57.7 35 9/1/2010 3:00:00 AM FIONA 16.9 -59.4 35 9/1/2010 9:00:00 AM FIONA 17.4 -60.2 40 9/1/2010 3:00:00 PM FIONA 18.8 -61.7 50 9/1/2010 9:00:00 PM FIONA 20.2 -62.9 50 9/2/2010 3:00:00 AM FIONA 21.8 -64.1 50 9/2/2010 9:00:00 AM FIONA 22.6 -65.4 45 9/2/2010 3:00:00 PM FIONA 24.4 -65.8 45 9/2/2010 9:00:00 PM FIONA 25.6 -66.4 45 9/3/2010 3:00:00 AM FIONA 26.9 -66.8 45 9/3/2010 9:00:00 AM FIONA 28.1 -66.7 45 9/3/2010 3:00:00 PM FIONA 29.0 -66.4 40 9/3/2010 9:00:00 PM FIONA 30.0 -65.5 35 9/4/2010 3:00:00 AM FIONA 31.4 -64.9 25
Date Storm Name Avg(Latitude) Avg(Longitude) Avg(Wind Speed (Kt)) 8/11/2010 3:00:00 AM FIVE 26.2 -84.2 30 8/11/2010 9:00:00 AM FIVE 26.8 -85.1 30 8/11/2010 3:00:00 PM FIVE 27.8 -86.8 25 8/11/2010 9:00:00 PM FIVE 28.3 -87.6 25
Date Storm Name Avg(Latitude) Avg(Longitude) Avg(Wind Speed (Kt)) 9/1/2010 3:00:00 PM GASTON 12.4 -35.8 30 9/1/2010 9:00:00 PM GASTON 12.9 -37.0 35 9/2/2010 3:00:00 AM GASTON 13.4 -37.7 35 9/2/2010 9:00:00 AM GASTON 13.5 -38.2 35 9/2/2010 3:00:00 PM GASTON 14.0 -38.9 30 9/2/2010 9:00:00 PM GASTON 13.5 -39.5 25
Date Storm Name Avg(Latitude) Avg(Longitude) Avg(Wind Speed (Kt)) 9/6/2010 3:00:00 AM HERMINE 20.7 -95.2 25 9/6/2010 9:00:00 AM HERMINE 21.6 -95.0 35 9/6/2010 3:00:00 PM HERMINE 23.4 -95.8 45 9/6/2010 9:00:00 PM HERMINE 24.5 -97.0 50 9/7/2010 3:00:00 AM HERMINE 25.5 -97.5 50 9/7/2010 9:00:00 AM HERMINE 27.0 -98.0 45 9/7/2010 3:00:00 PM HERMINE 28.3 -98.2 35 9/7/2010 9:00:00 PM HERMINE 29.9 -98.7 35 9/8/2010 3:00:00 AM HERMINE 31.6 -99.5 30 9/8/2010 9:00:00 AM HERMINE 32.1 -99.4 25 9/8/2010 3:00:00 PM HERMINE 32.9 -99.1 20 9/8/2010 9:00:00 PM HERMINE 33.9 -99.1 20 9/9/2010 3:00:00 AM HERMINE 34.9 -98.0 20
Date Storm Name Avg(Latitude) Avg(Longitude) Avg(Wind Speed (Kt)) 9/8/2010 3:00:00 PM IGOR 13.7 -23.5 35 9/8/2010 9:00:00 PM IGOR 13.9 -23.9 40 9/9/2010 3:00:00 AM IGOR 13.8 -24.6 40 9/9/2010 9:00:00 AM IGOR 13.8 -24.3 35 9/9/2010 3:00:00 PM IGOR 14.7 -24.8 35 9/9/2010 9:00:00 PM IGOR 16.0 -26.4 30 9/10/2010 3:00:00 AM IGOR 15.4 -28.0 30 9/10/2010 9:00:00 AM IGOR 16.0 -29.3 30 9/10/2010 3:00:00 PM IGOR 16.4 -31.0 35 9/10/2010 9:00:00 PM IGOR 16.7 -33.3 40 9/11/2010 3:00:00 AM IGOR 17.1 -34.9 45 9/11/2010 9:00:00 AM IGOR 17.1 -37.8 60 9/11/2010 3:00:00 PM IGOR 17.4 -39.5 60 9/11/2010 9:00:00 PM IGOR 17.4 -41.2 60 9/12/2010 3:00:00 AM IGOR 17.7 -42.5 65 9/12/2010 9:00:00 AM IGOR 17.7 -44.4 70 9/12/2010 3:00:00 PM IGOR 17.7 -45.7 90 9/12/2010 9:00:00 PM IGOR 17.7 -46.9 120 9/13/2010 3:00:00 AM IGOR 17.6 -47.8 130 9/13/2010 9:00:00 AM IGOR 17.7 -48.8 130 9/13/2010 3:00:00 PM IGOR 17.5 -49.7 130 9/13/2010 9:00:00 PM IGOR 17.7 -50.5 130 9/14/2010 3:00:00 AM IGOR 17.7 -51.2 120 9/14/2010 9:00:00 AM IGOR 17.9 -51.7 115 9/14/2010 3:00:00 PM IGOR 18.3 -52.3 115 9/14/2010 9:00:00 PM IGOR 18.8 -53.1 125 9/15/2010 3:00:00 AM IGOR 19.0 -53.9 135 9/15/2010 9:00:00 AM IGOR 19.5 -54.5 125 9/15/2010 3:00:00 PM IGOR 19.8 -55.0 115 9/15/2010 9:00:00 PM IGOR 20.1 -55.6 115 9/16/2010 3:00:00 AM IGOR 20.2 -56.5 115 9/16/2010 9:00:00 AM IGOR 20.5 -56.8 125 9/16/2010 3:00:00 PM IGOR 21.1 -57.2 120 9/16/2010 9:00:00 PM IGOR 21.7 -58.1 110 9/17/2010 3:00:00 AM IGOR 22.0 -58.7 110 9/17/2010 9:00:00 AM IGOR 22.4 -59.4 110 9/17/2010 3:00:00 PM IGOR 23.1 -60.1 105 9/17/2010 9:00:00 PM IGOR 23.7 -61.1 90 9/18/2010 3:00:00 AM IGOR 24.6 -62.0 95 9/18/2010 9:00:00 AM IGOR 25.1 -62.8 95 9/18/2010 3:00:00 PM IGOR 26.0 -63.6 95 9/18/2010 9:00:00 PM IGOR 27.1 -64.3 85 9/19/2010 3:00:00 AM IGOR 28.2 -64.7 85 9/19/2010 9:00:00 AM IGOR 28.9 -65.3 75 9/19/2010 3:00:00 PM IGOR 30.4 -65.4 75 9/19/2010 9:00:00 PM IGOR 31.5 -65.9 70 9/20/2010 3:00:00 AM IGOR 32.4 -65.5 65 9/20/2010 9:00:00 AM IGOR 34.2 -64.4 65 9/20/2010 3:00:00 PM IGOR 36.1 -63.3 65 9/20/2010 9:00:00 PM IGOR 38.2 -61.5 65 9/21/2010 3:00:00 AM IGOR 39.9 -59.3 65 9/21/2010 9:00:00 AM IGOR 42.8 -55.1 65 9/21/2010 3:00:00 PM IGOR 46.2 -52.8 65 9/21/2010 9:00:00 PM IGOR 49.3 -51.7 70
Date Storm Name Avg(Latitude) Avg(Longitude) Avg(Wind Speed (Kt)) 9/12/2010 3:00:00 PM JULIA 12.7 -21.4 30 9/12/2010 9:00:00 PM JULIA 13.3 -22.8 30 9/13/2010 3:00:00 AM JULIA 13.5 -23.5 35 9/13/2010 9:00:00 AM JULIA 14.4 -24.6 35 9/13/2010 3:00:00 PM JULIA 14.9 -26.1 35 9/13/2010 9:00:00 PM JULIA 15.3 -27.5 45 9/14/2010 3:00:00 AM JULIA 15.6 -28.0 45 9/14/2010 9:00:00 AM JULIA 16.1 -29.0 65 9/14/2010 3:00:00 PM JULIA 16.2 -29.5 75 9/14/2010 9:00:00 PM JULIA 16.7 -30.2 75 9/15/2010 3:00:00 AM JULIA 16.7 -30.9 90 9/15/2010 9:00:00 AM JULIA 17.3 -31.8 115 9/15/2010 3:00:00 PM JULIA 18.2 -32.7 115 9/15/2010 9:00:00 PM JULIA 19.2 -33.5 110 9/16/2010 3:00:00 AM JULIA 20.2 -34.6 100 9/16/2010 9:00:00 AM JULIA 21.2 -36.2 90 9/16/2010 3:00:00 PM JULIA 22.4 -38.6 85 9/16/2010 9:00:00 PM JULIA 23.1 -41.1 75 9/17/2010 3:00:00 AM JULIA 23.5 -42.9 70 9/17/2010 9:00:00 AM JULIA 23.8 -45.1 75 9/17/2010 3:00:00 PM JULIA 24.2 -46.7 75 9/17/2010 9:00:00 PM JULIA 25.2 -48.2 65 9/18/2010 3:00:00 AM JULIA 26.0 -49.2 60 9/18/2010 9:00:00 AM JULIA 27.4 -50.1 50 9/18/2010 3:00:00 PM JULIA 28.9 -51.0 45 9/18/2010 9:00:00 PM JULIA 30.6 -51.8 45 9/19/2010 3:00:00 AM JULIA 32.4 -51.9 45 9/19/2010 9:00:00 AM JULIA 33.6 -51.8 45 9/19/2010 3:00:00 PM JULIA 34.2 -50.3 45 9/19/2010 9:00:00 PM JULIA 34.8 -49.7 40 9/20/2010 3:00:00 AM JULIA 35.2 -48.7 35 9/20/2010 9:00:00 AM JULIA 35.5 -47.9 40 9/20/2010 3:00:00 PM JULIA 34.7 -46.4 40
Date Storm Name Avg(Latitude) Avg(Longitude) Avg(Wind Speed (Kt)) 9/14/2010 9:00:00 PM KARL 18.3 -84.2 35 9/15/2010 3:00:00 AM KARL 18.6 -85.5 40 9/15/2010 9:00:00 AM KARL 18.5 -86.7 55 9/15/2010 3:00:00 PM KARL 18.6 -88.2 50 9/15/2010 9:00:00 PM KARL 19.0 -89.4 40 9/16/2010 3:00:00 AM KARL 19.4 -90.7 35 9/16/2010 9:00:00 AM KARL 19.8 -91.6 45 9/16/2010 3:00:00 PM KARL 19.7 -92.8 65 9/16/2010 9:00:00 PM KARL 19.6 -93.7 70 9/17/2010 3:00:00 AM KARL 19.7 -94.5 85 9/17/2010 9:00:00 AM KARL 19.7 -95.3 105 9/17/2010 3:00:00 PM KARL 19.4 -95.9 105 9/17/2010 9:00:00 PM KARL 19.1 -96.6 80 9/18/2010 3:00:00 AM KARL 18.6 -97.4 30 9/18/2010 9:00:00 AM KARL 18.5 -97.6 20
Date Storm Name Avg(Latitude) Avg(Longitude) Avg(Wind Speed (Kt)) 9/21/2010 3:00:00 AM LISA 17.1 -31.9 30 9/21/2010 9:00:00 AM LISA 17.7 -31.8 35 9/21/2010 3:00:00 PM LISA 18.1 -31.7 40 9/21/2010 9:00:00 PM LISA 18.3 -31.6 40 9/22/2010 3:00:00 AM LISA 18.2 -31.3 40 9/22/2010 9:00:00 AM LISA 18.0 -30.5 40 9/22/2010 3:00:00 PM LISA 17.1 -30.5 40 9/22/2010 9:00:00 PM LISA 17.7 -30.2 40 9/23/2010 3:00:00 AM LISA 17.7 -29.6 35 9/23/2010 9:00:00 AM LISA 17.7 -29.0 30 9/23/2010 3:00:00 PM LISA 17.5 -28.9 30 9/23/2010 9:00:00 PM LISA 17.5 -28.6 35 9/24/2010 3:00:00 AM LISA 18.1 -28.1 35 9/24/2010 9:00:00 AM LISA 18.4 -27.8 35 9/24/2010 3:00:00 PM LISA 18.9 -27.8 45 9/24/2010 9:00:00 PM LISA 20.0 -27.8 50 9/25/2010 3:00:00 AM LISA 20.7 -27.9 70 9/25/2010 9:00:00 AM LISA 21.6 -28.1 65 9/25/2010 3:00:00 PM LISA 22.7 -28.2 60 9/25/2010 9:00:00 PM LISA 23.7 -28.4 45 9/26/2010 3:00:00 AM LISA 24.3 -29.0 40 9/26/2010 9:00:00 AM LISA 25.1 -29.0 30 9/26/2010 3:00:00 PM LISA 25.6 -29.1 30 9/26/2010 9:00:00 PM LISA 26.1 -29.4 25
Date Storm Name Avg(Latitude) Avg(Longitude) Avg(Wind Speed (Kt)) 9/23/2010 9:00:00 PM MATTHEW 14.0 -76.9 35 9/24/2010 3:00:00 AM MATTHEW 14.0 -78.4 40 9/24/2010 9:00:00 AM MATTHEW 14.3 -79.8 45 9/24/2010 3:00:00 PM MATTHEW 14.4 -82.2 45 9/24/2010 9:00:00 PM MATTHEW 14.7 -83.7 40 9/25/2010 3:00:00 AM MATTHEW 15.2 -85.0 45 9/25/2010 9:00:00 AM MATTHEW 15.7 -86.3 45 9/25/2010 3:00:00 PM MATTHEW 16.2 -87.8 35 9/25/2010 9:00:00 PM MATTHEW 17.4 -89.4 30 9/26/2010 3:00:00 AM MATTHEW 17.0 -91.0 30 9/26/2010 9:00:00 AM MATTHEW 17.3 -91.8 25 9/26/2010 3:00:00 PM MATTHEW 17.4 -92.9 20
Date Storm Name Avg(Latitude) Avg(Longitude) Avg(Wind Speed (Kt)) 9/28/2010 3:00:00 PM NICOLE 20.6 -82.5 30 9/28/2010 9:00:00 PM NICOLE 21.5 -82.4 30 9/29/2010 3:00:00 AM NICOLE 21.9 -81.9 30 9/29/2010 9:00:00 AM NICOLE 23.3 -81.4 30 9/29/2010 3:00:00 PM NICOLE 22.6 -80.6 35 9/29/2010 9:00:00 PM NICOLE 24.5 -80.0 35
Date Storm Name Avg(Latitude) Avg(Longitude) Avg(Wind Speed (Kt)) 10/6/2010 9:00:00 AM OTTO 22.2 -67.0 30 10/6/2010 3:00:00 PM OTTO 23.0 -68.0 30 10/6/2010 9:00:00 PM OTTO 23.2 -68.3 35 10/7/2010 3:00:00 AM OTTO 23.5 -68.2 55 10/7/2010 9:00:00 AM OTTO 23.6 -68.2 50 10/7/2010 3:00:00 PM OTTO 23.8 -68.0 50 10/7/2010 9:00:00 PM OTTO 24.0 -67.6 50 10/8/2010 3:00:00 AM OTTO 24.1 -66.6 50 10/8/2010 9:00:00 AM OTTO 24.8 -65.5 60 10/8/2010 3:00:00 PM OTTO 25.9 -64.0 65 10/8/2010 9:00:00 PM OTTO 26.8 -62.3 70 10/9/2010 3:00:00 AM OTTO 27.8 -60.8 75 10/9/2010 9:00:00 AM OTTO 29.2 -58.5 75 10/9/2010 3:00:00 PM OTTO 30.7 -55.7 65 10/9/2010 9:00:00 PM OTTO 32.4 -52.6 65 10/10/2010 3:00:00 AM OTTO 33.9 -48.7 60 10/10/2010 9:00:00 AM OTTO 35.3 -45.0 55 10/10/2010 3:00:00 PM OTTO 37.3 -41.1 55
Date Storm Name Avg(Latitude) Avg(Longitude) Avg(Wind Speed (Kt)) 10/11/2010 9:00:00 PM PAULA 16.0 -84.0 50 10/12/2010 3:00:00 AM PAULA 16.8 -84.6 60 10/12/2010 9:00:00 AM PAULA 17.6 -85.2 65 10/12/2010 3:00:00 PM PAULA 18.6 -85.7 65 10/12/2010 9:00:00 PM PAULA 19.2 -86.0 85 10/13/2010 3:00:00 AM PAULA 19.9 -86.0 85 10/13/2010 9:00:00 AM PAULA 20.7 -86.0 85 10/13/2010 3:00:00 PM PAULA 21.3 -85.8 85 10/13/2010 9:00:00 PM PAULA 21.7 -85.6 75 10/14/2010 3:00:00 AM PAULA 21.9 -85.4 70 10/14/2010 9:00:00 AM PAULA 22.3 -84.9 65 10/14/2010 3:00:00 PM PAULA 22.8 -84.1 60 10/14/2010 9:00:00 PM PAULA 22.8 -82.8 50 10/15/2010 3:00:00 AM PAULA 23.1 -81.4 40 10/15/2010 9:00:00 AM PAULA 23.1 -80.2 30 10/15/2010 3:00:00 PM PAULA 22.8 -79.5 20
Date Storm Name Avg(Latitude) Avg(Longitude) Avg(Wind Speed (Kt)) 10/21/2010 3:00:00 AM RICHARD 17.5 -81.1 30 10/21/2010 9:00:00 AM RICHARD 17.0 -80.7 30 10/21/2010 3:00:00 PM RICHARD 16.2 -80.4 35 10/21/2010 9:00:00 PM RICHARD 16.0 -80.4 40 10/22/2010 3:00:00 AM RICHARD 15.9 -80.5 40 10/22/2010 9:00:00 AM RICHARD 16.0 -80.3 40 10/22/2010 3:00:00 PM RICHARD 15.8 -81.1 40 10/22/2010 9:00:00 PM RICHARD 16.2 -81.7 45 10/23/2010 3:00:00 AM RICHARD 15.8 -82.4 45 10/23/2010 9:00:00 AM RICHARD 15.8 -83.2 45 10/23/2010 3:00:00 PM RICHARD 15.9 -83.5 65 10/23/2010 9:00:00 PM RICHARD 16.1 -84.2 65 10/24/2010 3:00:00 AM RICHARD 16.3 -84.6 70 10/24/2010 9:00:00 AM RICHARD 16.5 -85.5 70 10/24/2010 3:00:00 PM RICHARD 16.9 -86.9 85 10/24/2010 9:00:00 PM RICHARD 17.2 -88.0 90 10/25/2010 3:00:00 AM RICHARD 17.3 -88.6 90 10/25/2010 9:00:00 AM RICHARD 17.6 -89.6 65 10/25/2010 3:00:00 PM RICHARD 17.8 -90.2 30 10/25/2010 9:00:00 PM RICHARD 18.1 -91.2 30 10/26/2010 3:00:00 AM RICHARD 18.4 -91.6 25 10/26/2010 9:00:00 AM RICHARD 19.4 -92.5 25 10/26/2010 3:00:00 PM RICHARD 20.4 -93.1 25
Date Storm Name Avg(Latitude) Avg(Longitude) Avg(Wind Speed (Kt)) 10/29/2010 3:00:00 AM SHARY 27.3 -63.7 35 10/29/2010 9:00:00 AM SHARY 28.5 -65.0 35 10/29/2010 3:00:00 PM SHARY 29.6 -66.2 35 10/29/2010 9:00:00 PM SHARY 30.9 -65.0 55 10/30/2010 3:00:00 AM SHARY 31.9 -63.3 60 10/30/2010 9:00:00 AM SHARY 33.6 -59.4 65 10/30/2010 3:00:00 PM SHARY 35.9 -55.6 65 10/30/2010 9:00:00 PM SHARY 39.2 -50.9 60
Date Storm Name Avg(Latitude) Avg(Longitude) Avg(Wind Speed (Kt)) 10/29/2010 9:00:00 PM TOMAS 11.1 -57.5 35 10/30/2010 3:00:00 AM TOMAS 12.2 -58.4 55 10/30/2010 9:00:00 AM TOMAS 12.9 -59.5 60 10/30/2010 3:00:00 PM TOMAS 13.3 -60.7 65 10/30/2010 9:00:00 PM TOMAS 13.5 -61.4 65 10/31/2010 3:00:00 AM TOMAS 13.6 -62.1 80 10/31/2010 9:00:00 AM TOMAS 14.0 -62.9 85 10/31/2010 3:00:00 PM TOMAS 14.0 -63.7 80 10/31/2010 9:00:00 PM TOMAS 14.4 -64.9 65 11/1/2010 3:00:00 AM TOMAS 14.2 -66.5 55 11/1/2010 9:00:00 AM TOMAS 13.8 -67.7 45 11/1/2010 3:00:00 PM TOMAS 13.6 -68.7 40 11/1/2010 9:00:00 PM TOMAS 13.4 -69.7 40 11/2/2010 3:00:00 AM TOMAS 13.5 -70.8 40 11/2/2010 9:00:00 AM TOMAS 13.5 -72.0 45 11/2/2010 3:00:00 PM TOMAS 13.5 -72.6 45 11/2/2010 9:00:00 PM TOMAS 13.5 -74.6 35 11/3/2010 3:00:00 AM TOMAS 13.7 -75.1 35 11/3/2010 9:00:00 AM TOMAS 13.5 -75.5 30 11/3/2010 3:00:00 PM TOMAS 14.1 -75.9 30 11/3/2010 9:00:00 PM TOMAS 14.9 -74.8 40 11/4/2010 3:00:00 AM TOMAS 15.4 -75.2 40 11/4/2010 9:00:00 AM TOMAS 15.8 -76.1 45 11/4/2010 3:00:00 PM TOMAS 16.3 -76.1 45 11/4/2010 9:00:00 PM TOMAS 16.6 -76.0 45 11/5/2010 3:00:00 AM TOMAS 17.3 -75.5 55 11/5/2010 9:00:00 AM TOMAS 18.1 -74.9 70 11/5/2010 3:00:00 PM TOMAS 19.1 -74.4 75 11/5/2010 9:00:00 PM TOMAS 20.3 -73.8 65 11/6/2010 3:00:00 AM TOMAS 20.8 -72.8 65 11/6/2010 9:00:00 AM TOMAS 21.9 -71.3 60 11/6/2010 3:00:00 PM TOMAS 23.1 -70.6 55 11/6/2010 9:00:00 PM TOMAS 24.2 -70.0 55 11/7/2010 3:00:00 AM TOMAS 25.2 -69.6 70 11/7/2010 9:00:00 AM TOMAS 26.2 -68.8 65 11/7/2010 3:00:00 PM TOMAS 26.0 -69.6 50 11/7/2010 9:00:00 PM TOMAS 26.1 -69.1 50